Tutorials
How to Calculate Your Retirement Number
By Editorial Team · Published December 22, 2025 · Updated August 22, 2026 · 12 min read
Three ways to set your retirement number — replacement rate, 25x on the gap, and a bottom-up build — worked through one household with a claim-delay bridge.
Ask three financially literate people how big a retirement nest egg you need and you'll get three different numbers, all defended with conviction. One multiplies your salary by some factor. One multiplies your spending by 25. One opens a spreadsheet and starts listing expenses line by line. They're not contradicting each other so much as answering slightly different questions at different levels of precision — and the gap between their answers, often hundreds of thousands of dollars, is exactly the thing you have to resolve before the number means anything.
This is a procedure, not a single formula. The honest version has stages: a fast estimate to see if you're in the right galaxy, a sharper estimate that respects how you actually spend, and a habit that keeps the number honest as your life changes. Work it in that order and the final figure stops feeling like a guess pulled from a calculator and starts feeling like something you can defend to yourself.
First, decide what the number is even measuring
Before any arithmetic, settle one definition, because almost every botched retirement number traces back to skipping it: your retirement number is the amount of invested capital that has to exist on the day you stop working so the portfolio can cover the part of your spending that nothing else covers.
Read that twice. It is not "enough money for my whole lifestyle." Social Security covers a chunk. A pension, if you have one, covers more. Part-time income, rental income, an annuity — each shrinks what the portfolio itself must produce. The portfolio is the last resort that fills the gap between total spending and guaranteed income, and the entire calculation lives or dies on that distinction. People who forget it routinely conclude they can never retire when, after the guaranteed pieces are layered in, they're far closer than they think.
So every method below is really estimating the same thing two different ways: how much spending lands on the portfolio, and what multiple of that spending you need saved.
Method 1 — the replacement-rate shortcut (the back-of-envelope)
The fastest estimate ignores your actual budget entirely and works off income. The premise: in retirement you stop saving for retirement, payroll taxes drop, and the commute, work wardrobe, and lunches-out fade — so most households need somewhere in the rough neighborhood of 70% to 85% of pre-retirement gross income to keep the same standard of living.
Run it for a household earning $120,000:
- Pick a replacement rate. Say 80%. Target retirement income = $96,000 a year.
- Subtract guaranteed income. Estimated Social Security for the couple, say, $40,000. Remaining gap = $56,000.
- Convert the gap to capital with a withdrawal multiple. Using 25×: $56,000 × 25 = $1,400,000.
Done — but understand what you just bought. This estimate is fast and roughly directionally right, and it is also blind to your spending. A household that paid off its mortgage needs a far lower replacement rate than one still carrying a thirty-year note into retirement. A frugal high earner who already lives on half their income is wildly over-targeted by 80%. Use the replacement-rate number to find out whether you're looking at a $700,000 problem or a $3,000,000 problem. Don't use it as the final answer.
Method 2 — the 25× rule (spending-driven, still fast)
The second method skips income and works straight from spending, which is more honest because it's your spending, not your salary, that the portfolio has to fund.
The 25× multiple comes from inverting a roughly 4% sustainable starting withdrawal rate: if 4% of the portfolio funds one year, then one year of portfolio spending times 25 is the target. The procedure:
- Estimate annual retirement spending (total, all-in).
- Subtract every dollar of guaranteed annual income — Social Security, pension, annuity.
- Multiply the remaining gap by 25.
Two retirees, identical $80,000-a-year lifestyles, show why step 2 is the whole game:
| Retiree A | Retiree B | |
|---|---|---|
| Annual spending | $80,000 | $80,000 |
| Guaranteed income | $0 | $38,000 (SS + small pension) |
| Gap the portfolio funds | $80,000 | $42,000 |
| Target at 25× | $2,000,000 | $1,050,000 |
Same life, same rule, and a target that differs by $950,000 — driven entirely by guaranteed income. This is the single most expensive mistake in retirement math: running 25× against gross spending instead of the gap. Pressure-test your own gap-based figure with the Retirement Savings Calculator, which is built around exactly this total-minus-guaranteed-income logic rather than a salary multiple.
A footnote on the multiple itself. The 4%-derived 25× assumes roughly a 30-year retirement. Retire early — at 50, planning for a 45-year horizon — and sequence and inflation risk compound over the longer runway, which pushes many researchers toward a lower starting rate (around 3%–3.5%) and therefore a higher multiple, closer to 28×–33×. If early retirement is the plan, model the longer horizon explicitly with the FIRE Calculator rather than assuming the standard multiple still holds.
Method 3 — the bottom-up build (the one you actually trust)
The two shortcuts tell you the order of magnitude. The bottom-up method tells you the number you'd be willing to act on, because it's assembled from your real life instead of a national average.
The work is unglamorous: build your retirement budget category by category, in today's dollars, the way it'll actually look once you've stopped working — not the way it looks now.
- List essential annual costs as they'll be in retirement. Housing (is the mortgage gone by then?), utilities, food, insurance, transportation, healthcare. Healthcare deserves its own line and usually rises with age; if you'll retire before Medicare eligibility, price the bridge years separately because they can be brutal.
- List discretionary annual costs. Travel, hobbies, gifts, dining, the things that make retirement worth reaching. Be generous here — under-budgeting fun produces a number you'll quietly resent.
- Sum to total annual spending. Suppose it lands at $72,000.
- Subtract guaranteed income, year by year. This is where timing bites: if you retire at 64 but claim Social Security at 70, there are six years where the portfolio funds everything, then the load drops once benefits start. A single flat number hides that.
- Apply the multiple to the steady-state gap, then add a separate reserve for the front-loaded years.
Worked through for a concrete household — call them the Reyes household, both 64, retiring now:
- Total annual spending: $72,000.
- Social Security if both claim at 70: $46,000 combined — but not until age 70.
- Steady-state gap (age 70 onward): $72,000 − $46,000 = $26,000/yr. At 25×: $26,000 × 25 = $650,000.
- Bridge gap (ages 64–70, six years with zero Social Security): the portfolio covers the full $72,000. That's roughly $72,000 × 6 = $432,000 of spending concentrated in the early years, which you set aside as a separate, more conservatively invested bucket rather than blending it into the 25× figure (drawing 6× annual spending out of a portfolio in its first six years is precisely the sequence-risk scenario that wrecks plans).
- Rough total target: $650,000 + ~$432,000 ≈ $1,080,000, before taxes and a margin of safety.
Notice how different that is from what Method 1 would have spat out for a similar income. The bottom-up build surfaced two things the shortcuts hid: the Reyes household needs less steady-state capital than a salary multiple implied because their spending is modest, but it needs a chunky dedicated reserve for the claim-delay bridge that no simple multiple even mentions.
The tax line nobody puts in the budget
One adjustment separates a real number from a fictional one. If most of your savings sit in a traditional 401(k) or IRA, every dollar you spend from it is pre-tax — you withdraw, the IRS takes a cut, and what's left is what you actually spend. Spending $26,000 from a traditional account might require withdrawing somewhere around $30,000–$33,000 depending on your bracket and other income. The shortcuts speak in gross, pre-tax terms; you live net and after-tax. A practical fix is to inflate the portfolio-funded gap by a realistic effective tax rate before applying the multiple, and to remember that Roth dollars and taxable-account basis don't carry the same drag. The point isn't to nail the tax math to the penny years ahead of time — brackets and thresholds move annually — it's to stop pretending the gap is tax-free.
How sensitive the number is to its inputs
One reason people treat the retirement number as fragile is that they've never seen which inputs actually move it. They aren't equally powerful. Run the Reyes household's $26,000 steady-state gap and watch what shifts the target most:
| Change | New gap | Target at 25× | Shift |
|---|---|---|---|
| Baseline | $26,000 | $650,000 | — |
| Spend $6,000/yr more | $32,000 | $800,000 | +$150,000 |
| Social Security $4,000/yr lower | $30,000 | $750,000 | +$100,000 |
| Mortgage paid off, −$10,000 spending | $16,000 | $400,000 | −$250,000 |
| Use 30× (longer horizon) instead of 25× | $26,000 | $780,000 | +$130,000 |
The pattern is the point. The multiple and the market are the inputs people obsess over, but the largest single mover on that table is a controllable structural change to spending — retiring a mortgage. The lesson isn't that the number is unknowable; it's that the most powerful levers are the ones you can act on years ahead (debt, planned spending, claiming age), not the ones you can only worry about (returns). When the target comes back uncomfortably large, the productive question is "which of my inputs can I change?" rather than "what return do I need?"
There's also an asymmetry worth internalizing. Underestimating spending and overestimating Social Security both push the real number higher than your estimate — and people tend to make both errors in the same optimistic direction at once. A defensible practice is to run the calculation twice: once with your honest assumptions, once with spending nudged up and guaranteed income nudged down, and to treat the gap between those two numbers as the size of your uncertainty rather than pretending a single point estimate is the truth.
A note on inflation and "today's dollars"
Build the entire calculation in today's dollars and keep it there. The reason is practical, not pedantic: if you estimate spending in today's prices, use a withdrawal multiple derived from inflation-adjusted (real) sustainable rates, and pull a Social Security estimate that's already expressed in today's terms, then every figure is on the same footing and the arithmetic is honest. The 4%-derived multiple already assumes the withdrawal rises with inflation each year, so it's doing the inflation work for you — you don't separately inflate the target. The mistake to avoid is mixing frames: projecting spending forward into inflated future dollars and then applying a real multiple, which double-counts and badly overstates the number. Pick today's dollars, state it explicitly, and never let a future-dollar figure sneak into the same calculation.
Sequence risk is why the number isn't the finish line
You can compute a perfect target and still run out of money, because when bad returns arrive matters more than the average. Two retirees with identical 30-year average returns finish in completely different places if one of them hit a sharp downturn in years one through five while drawing income from a shrinking balance. A correct retirement number assumes a withdrawal strategy that can bend — freezing or trimming spending after an early crash — rather than mechanically taking an inflation raise into a falling market. If your budget genuinely cannot flex, you need to target the high end of every range above, because you've given up the release valve. Stress-testing how long a given balance survives under hostile return ordering, rather than average ordering, is what the Money Longevity Calculator is for, and running it usually does more to change behavior than recalculating the target a fourth time.
The annual revisit — the part everyone skips
A retirement number computed once and filed away is decorative. The inputs that feed it — your spending, your Social Security estimate, your time horizon, tax law, market levels — all drift. Build a fifteen-minute annual habit:
- Pull your latest Social Security estimate from the official statement (it changes as your earnings record updates and as you approach claiming age).
- Re-estimate annual spending against what you actually spent last year, not what you guessed five years ago.
- Recompute the gap and the multiple.
- Compare the new target to your current trajectory and adjust the controllable lever — savings rate, retirement date, or planned spending — rather than hoping returns close the gap for you.
Done yearly, the number stops being a one-time verdict and becomes a steering input. Most people overestimate how precise the initial calculation needs to be and badly underestimate how much the annual course-correction does. A roughly right number revisited every year beats a precisely wrong one carved in stone.
Putting the three methods together
The methods aren't rivals; they're a sequence with increasing resolution. Run the replacement-rate shortcut to learn the scale of the problem in five minutes. Run 25× on the gap to get a spending-honest figure you can quote. Build it bottom-up to get a number you'd actually retire on, complete with the bridge reserve and a tax adjustment. Then revisit annually so the number tracks the life it's supposed to fund. Each stage corrects a blindness in the one before it, and the discipline of doing all three — instead of stopping at whichever gave the friendliest answer — is what makes the final figure trustworthy.
Sources
- Consumer Financial Protection Bureau — plain-language retirement planning worksheets and guidance on estimating future spending
- Social Security Administration — official benefit estimates that determine how large a gap the portfolio actually has to fill
- Internal Revenue Service — current contribution limits and the pre-tax withdrawal rules that turn gross targets into after-tax spending
- U.S. Department of Labor — savings-rate and fee guidance from the agency that oversees employer retirement plans
Key takeaways
- Your retirement number is invested capital sized to the gap between total spending and guaranteed income — never a multiple of total spending or salary.
- Use three methods in order: replacement-rate for scale, 25× on the gap for a quick honest figure, bottom-up for the number you'd act on.
- Claiming-delay years and the pre-Medicare bridge create a front-loaded reserve that no simple multiple captures — size it separately.
- Add a tax line: pre-tax accounts mean gross withdrawals exceed the spending they fund, so the real target is larger than the headline.
- Recompute every year and adjust the controllable levers; an annually revised approximate number beats a one-time precise one.
Treat every figure in this walkthrough as a worked illustration of the method, not a recommendation calibrated to your situation — your bracket, horizon, account mix, and Social Security record are specific to you, and a one-time calculation is a starting point for a conversation with a qualified advisor, not a substitute for one.
Run the numbers
Everything below came out of this site's own Retirement Savings Calculator. The figures are not quoted from anywhere else: each row is one run of the same calculation the tool page performs, using August 2026 rules. Put the same inputs in and you will get the same output.
How the result moves with current savings
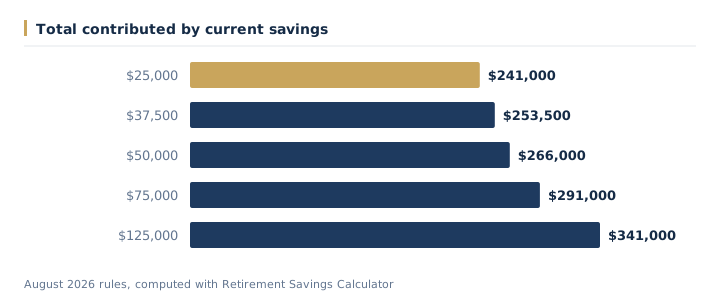
We ran 5 values of current savings through the calculator and left every other input at its default. As of August 2026, the output was:
| Current savings ($) | Total contributed ($) | Projected balance ($) | Real balance today dollars ($) |
|---|---|---|---|
| 25,000 | 241,000 | 870,424.04 | 358,603.18 |
| 37,500 | 253,500 | 965,577.23 | 397,805.03 |
| 50,000 | 266,000 | 1,060,730.41 | 437,006.89 |
| 75,000 | 291,000 | 1,251,036.79 | 515,410.59 |
| 125,000 | 341,000 | 1,631,649.54 | 672,218.01 |
Running current savings from $25,000 up to $125,000 moves total contributed from $241,000 to $341,000 — a spread of $100,000. That gap is the part a single headline rate never shows.
The same runs seen through projected balance
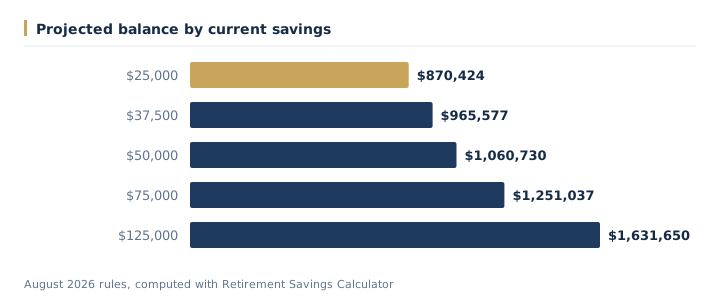
At $25,000, projected balance works out to $870,424; at $125,000 it is $1,631,650. Looking only at total contributed tends to understate how much the outcome shifts across that range.
Assumptions behind these figures
| Input | Value |
|---|---|
| Current age | 35 |
| Retire age | 65 |
| Current savings | $50,000 |
| Monthly | $600 |
| Ret | 7% |
| Infl | 3% |
| As of | August 2026 |
| Method | identical to /tools/retirement-savings-calculator |
Brackets, thresholds and rates change from year to year, so treat these as August 2026 figures for the 2026 tax year. For your own situation, open the Retirement Savings Calculator and enter your real numbers — the calculator runs the same code that produced every figure on this page.
Frequently Asked Questions
How do I calculate my retirement number?
A reliable approach generally combines multiple methods rather than relying on one: a quick income-replacement estimate, a spending-based 25x calculation, and a detailed bottom-up budget built from your actual expected expenses. Each shortcut method has blind spots, so using them together and treating a large disagreement between them as a signal to dig deeper tends to produce a more trustworthy number. The core concept underlying most methods is the same: your retirement number should represent the capital needed to cover spending that guaranteed income sources don't already cover.
What's the difference between the replacement-rate method and the 25x rule?
The replacement-rate method estimates retirement income needs as a percentage — often in the rough range of 70% to 85% — of your pre-retirement income, while the 25x rule works from your actual expected spending and multiplies the portion not covered by guaranteed income by roughly 25. The replacement-rate method is faster but assumes your retirement spending will track your working-age income, which isn't accurate for everyone. The 25x method is generally considered more precise since it's based on your real spending rather than a percentage of salary.
Why should I subtract guaranteed income before applying the 25x rule?
Because the 25x multiple is meant to size only the portion of spending your investment portfolio actually has to fund, not your entire lifestyle. Guaranteed income sources like Social Security or a pension can cover a substantial share of spending, so failing to subtract them before multiplying by 25 can overstate your required savings by a very large margin. Two people with identical spending but different levels of guaranteed income can have dramatically different real retirement targets.
Is the bottom-up budgeting method more accurate than shortcuts?
Generally, yes — building a retirement budget line by line from your actual anticipated expenses tends to produce a more defensible and personalized number than either the replacement-rate shortcut or the simple 25x multiple, since it's based on your real life rather than national averages. It requires more effort, including separating essential costs from discretionary ones and accounting for healthcare, especially if retiring before Medicare eligibility. Many people use the quick methods to get in the right range first, then refine with a detailed bottom-up budget.